
01 //Training course
Full Stack Analyst
- Track
- Data & Analytics
- Duration
- 90 Days
02 //Why this course
Why this course.
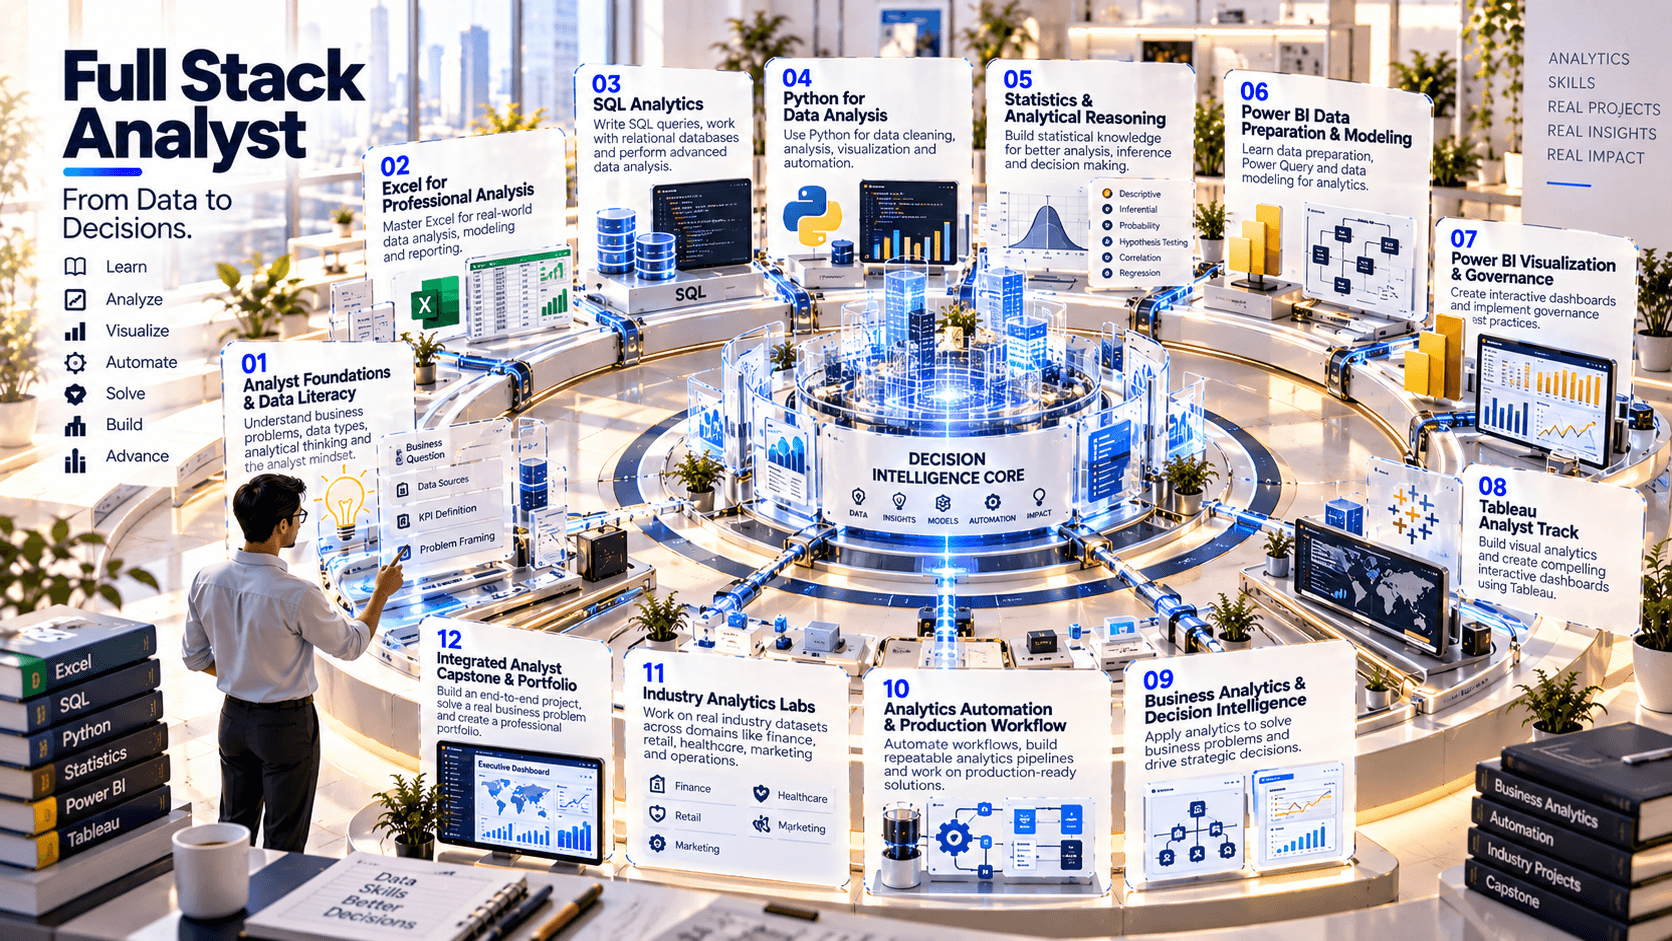
This 90-day program is positioned as an end-to-end analyst pathway: business questions → data acquisition → spreadsheet analysis → SQL → Python-based analysis → data visualization → semantic modeling → BI dashboards → insight communication → portfolio and capstone delivery. The intent is to make the learner capable of moving across the modern analyst workflow rather than learning one isolated reporting tool.
Full-Stack Analyst — Excel, SQL, Python, Data Visualization, Power BI & Business Analytics
Build the complete analyst workflow from raw data to business decision.
03 //Curriculum
Course phases.
04 //Technology stack
The tools you'll work with.
Spreadsheet analytics
Business analysis, modeling and rapid exploration
Microsoft Excel, Power Query, PivotTables
SQL
Relational querying, joins, aggregations and analytical SQL
PostgreSQL or SQL Server; optional MySQL
BI — primary
Semantic modeling, dashboards, analysis and governed reporting
Microsoft Power BI, Power Query, DAX
BI — secondary
Alternative visualization workflow and cross-tool analyst capability
Tableau
Version control
Portfolio, versioning and reproducibility
Git, GitHub
Documentation
Data dictionaries, analytical memos and stakeholder communication
Markdown, Excel, PowerPoint/Docs
Optional data layer
Realistic multi-table analytics exercises
SQLite / PostgreSQL sample warehouse
05 //Projects and practice
Learning by doing.
- 01
Business KPI Workbook
Build a reusable Excel performance tracker with formulas, pivots and management-ready summaries.
- 02
SQL Business Analysis
Analyze a relational sales/customer dataset using joins, CTEs, window functions and KPI queries.
- 03
Python Data Cleaning & EDA
Clean a messy dataset in pandas, document assumptions and produce an exploratory analysis notebook.
- 04
Power BI Executive Dashboard
Build a star-schema model, DAX measures and an executive dashboard with drill-through and KPI storytelling.
- 05
Tableau Analyst Challenge
Connect, prepare, analyze and publish a complementary dashboard using Tableau.
- 06
Integrated Business Case
Combine SQL + Python + Power BI into one decision-oriented analytics project with an executive memo.
06 //Capstone
Capstone options.
- 01
E-commerce Intelligence
sales, customer cohorts, conversion and retention.
- 02
Marketing Intelligence
channel performance, CAC/ROAS awareness, funnel and campaign analysis.
- 03
Financial Analytics
revenue, margin, expense and profitability dashboard.
- 04
Operations Intelligence
inventory, fulfillment, SLA and productivity analytics.
- 05
Product Analytics
activation, engagement, retention and feature-performance analysis.
07 //Assessment
How progress is checked.
- Analytics foundations
- Excel + SQL labs
- Python analytics
- Power BI
- Tableau / visualization
- Industry case studies
- Integrated capstone
08 //Learning journey
From foundation to capability.
How learning builds through a course. It describes the approach, not a promised outcome.
Foundation to capability
How learning builds
Stage 01
Foundation
The core concepts, vocabulary and tools the rest of the course builds on.
Stage 02
Practice
Guided exercises that turn concepts into working skills.
Stage 03
Application
Applying those skills to realistic problems and project work.
Stage 04
Capability
Using what you've learned with growing independence and judgement.
09 //Questions
Frequently asked questions.
Start learning
Ready to start learning?
Ask about training to talk through where this course fits your goals.