
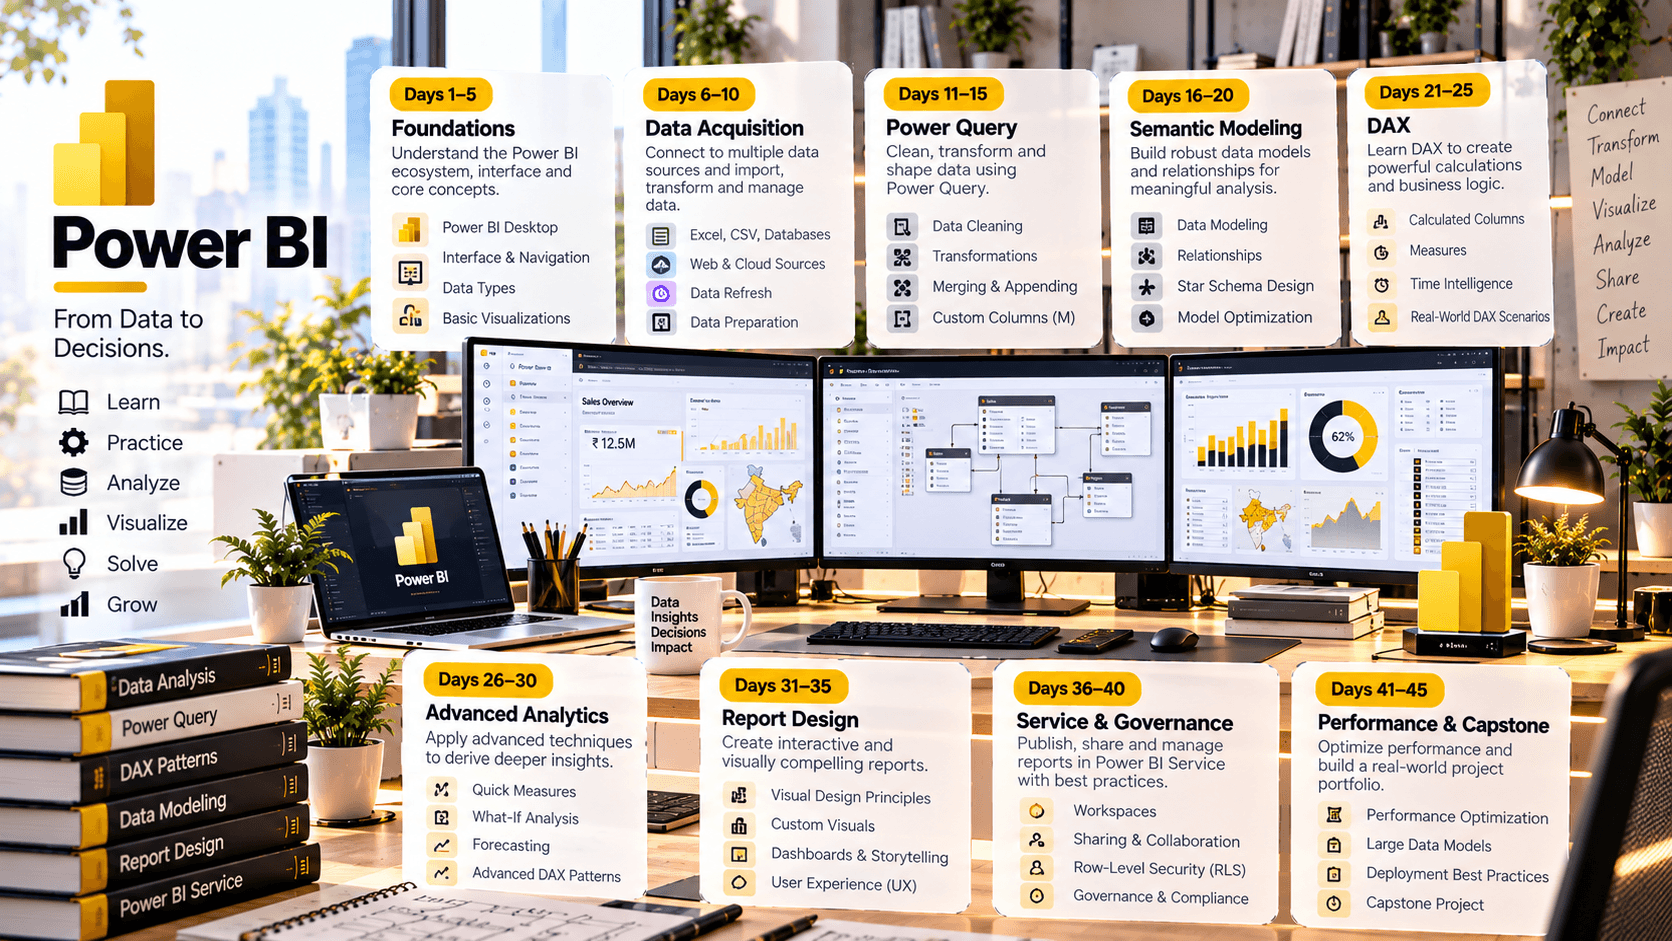
02 //Curriculum
Course phases.
03 //Technology stack
The tools you'll work with.
Tools
Microsoft Power BI Desktop
Power Query / Power Query Editor
DAX
Power BI Service
Power BI semantic models
Excel / CSV data sources
SQL Server or another relational SQL source for database connectivity practice
Microsoft Fabric concepts where relevant to the selected environment
Power BI Service workspaces and apps
RLS / OLS security concepts
Performance Analyzer and model-performance diagnostics
Power BI REST/API or automation concepts for advanced learnersOptional
04 //Projects and practice
Learning by doing.
- 01
Executive Sales Dashboard
Connect raw sales data, clean it, model dimensions/facts, create DAX KPIs and build an executive report.
- 02
Finance Performance Model
Build revenue, expense, margin, variance and time-intelligence measures with an auditable semantic model.
- 03
Operations Analytics
Analyze orders, inventory, fulfillment or productivity with drill-down, segmentation and exception reporting.
- 04
Marketing Performance Dashboard
Combine campaign/channel data, calculate conversion and ROI-style metrics, and design an executive storytelling report.
- 05
HR / Workforce Analytics
Build a governed workforce model with role-based access patterns and privacy-aware reporting.
- 06
Data Quality & Refresh Lab
Identify transformation issues, broken relationships, refresh errors and model-quality risks.
- 07
Security Lab
Implement and validate RLS for regional or departmental users and document the access model.
- 08
Service Publishing Lab
Publish a report, configure refresh/sharing, organize a workspace and distribute content through a Power BI app where supported.
05 //Capstone
Capstone options.
- 01
Enterprise Executive BI Suite
a multi-page management dashboard with a reusable semantic model, DAX KPI layer, drill-through and governed distribution.
- 02
Sales & Revenue Intelligence Platform
pipeline/revenue performance, product/customer analysis, targets, variance and time intelligence.
- 03
Operations Command Center
operational KPIs, exception analysis, trend monitoring and role-based access.
- 04
Marketing Intelligence Hub
channel performance, funnel metrics, campaign analysis and executive storytelling.
- 05
Finance Analytics Model
P&L-style reporting, variance analysis, period comparisons and controlled access.
06 //Assessment
How progress is checked.
- Power BI concepts & quizzes
- Power Query/data-preparation labs
- Semantic modeling & DAX labs
- Visualization & storytelling projects
- Service, security & governance lab
- Integrated capstone
- Executive presentation & documentation
07 //Learning journey
From foundation to capability.
How learning builds through a course. It describes the approach, not a promised outcome.
Foundation to capability
How learning builds
Stage 01
Foundation
The core concepts, vocabulary and tools the rest of the course builds on.
Stage 02
Practice
Guided exercises that turn concepts into working skills.
Stage 03
Application
Applying those skills to realistic problems and project work.
Stage 04
Capability
Using what you've learned with growing independence and judgement.
08 //Questions
Frequently asked questions.
Start learning
Ready to start learning?
Ask about training to talk through where this course fits your goals.